All the experiments were performed following the protocol approved by the Bioethics Committee at the Academy of Physical Education in Katowice, Poland, under the reference number 3/2020 on 17 December 2020, and according to the ethical standards of the Declaration of Helsinki 2013. We confirmed that they were carried out in accordance with relevant guidelines and regulations. Informed consent was obtained from all subjects involved in the study. The trial is registered under the number: ISRCTN41899475; (doi.orghttps://doi.org/10.1186/ISRCTN41899475). The HFUS imaging was performed by medical engineer with 5 years’ experience in HFUS ultrasound, graduated two dermatological HFUS courses. To reduce the possible influence of US operator and make the analysis repeatable, the US scanning was performed by the same person.
Materials
The female facial skin image data were collected during a prospective, randomized, controlled, single-center clinical trial designed to compare the skin condition before and after TCA intervention in two parallel groups of women receiving TCA chemical peeling or placebo. The procedure was applied to women at the age of 59–65, whose eligibility to participate was assessed by the aesthetic medicine doctor against the following criteria: Fitzpatrick skin type II–III, no contraindications for chemical exfoliation, no previous treatments of TCA chemical peels and no previous exfoliating and rejuvenating treatments within six months. The inclusion and exclusion criteria are summarized in Table 1.
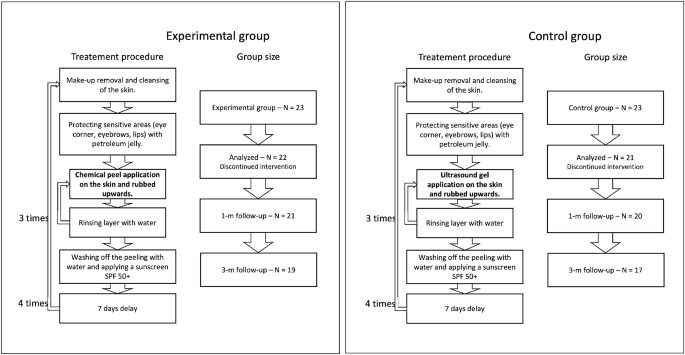
Summary of patient groups and treatment steps.
To blind the peel procedure, the personnel performing the procedure, data collectors, and data analysts did not know what substance was used, and the application procedure was the same in both the considered groups (per the TCA manufacturer recommendations). It includes make-up removal and cleansing of the skin, protecting sensitive areas with petroleum jelly, and applying the proper substances. Three layers of TCA (in the experimental group) and ultrasound gel (in the control group) were applied, with water rinsing in-between. After the last layer, the peeling/gel was washed off with water, and a cream with sunscreen SPF 50+ was applied. The application was carried out in four treatments every seven days. All the participants used soothing and moisturizing cream with SPF 50+ in daily care and up to three months after therapy. The novel TCA chemical peel (PQ Age Evolution®, Promoitalia, Italy) consists of: (1) Trichloroacetic acid \(34\%\) (TCA), which helps to remove discoloration and small scars, smooth the skin, reduces blackheads and affects the synthesis of collagen, (2) Kojic acid \(10\%\) with antibacterial and antifungal properties and combats discoloration, (3) \(5\%\) urea peroxide with lightning properties, (4) Coenzyme Q10 \(5\%\) with antioxidant properties.
The measurements were performed four times: at baseline—before the intervention, immediately after the last intervention, and one and three months post the last intervention. Patient groups with corresponding treatment procedures are summarized in Figure 1.
The required number of participants was evaluated based on the results of a pilot study, where five women were administered acid and five placebo. The assumptions for 2-way RM-ANOVA were met. Therefore the sample size was estimated using an eta-squared of the effect of hydration (measured using Multi Skin Test Center® MC750 B2, with the Corneometer® CM825 probe) for the between-factor analysis (eta-squared = 0.18). Setting alpha = 0.05, test power = 0.9, number of measurements = 6, number of groups = 2, correlation among repeated measures = 0.53, and eta-squared = 0.15, the total number of participants was 40 (at least 20 people in each group). Due to possible unpredictable and unavoidable factors, potentially reducing the group size, 23 people were qualified for each group, making the total sample size equal to 46. During the experiments, three participants were excluded from the analysis due to the absence or sunbathing, which is treated as possibly influencing the results. Consequently, the analysis was performed on 43 participants: 22 in the experimental group and 21 in the placebo group. The sample size agrees with the sizes described in the literature in similar experiments13,14,16,19.
The HFUS images were acquired using DUB SkinScanner75 (tpm, taberna pro medicum GmbH, Germany) with a 24 MHz (B-mode frequency, 8 mm depth, and acoustic intensity level 40 dB) transducer in three locations on the patient’s face. The locations and ultrasound probe movement directions are visualized in Figure 2 by three arrows superimposed into a facial model. The image acquisition starts where the arrow begins and ends with the arrow end. Several dozen HFUS images were collected for each location in a single series. The original image resolution was equal \(1386\times 3466\) [pix], and the pixel size is equal to \(0.0093\times 0.0023\) [mm/pix] (axial \(\times\) lateral). In total, 17425 HFUS frames of facial skin were acquired (available here23), from which only 3900 were considered relevant for the analysis (see Section Image selection).
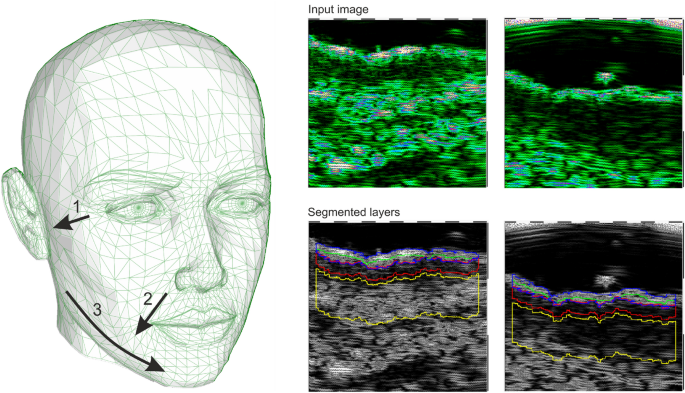
Left: facial model with superimposed image acquisition areas: the arrows indicate HFUS probe movement; Right: exemplary HFUS skin areas with segmented ROI for parameters estimation: blue – entry echo layer, green − 0.1 [mm] of upper epidermis, red − 0.2 [mm] ROI below the entry echo layer.
Skin parameters in ultrasound
Recent works12,13,15,16,24 indicate the parameters which can be measured in ultrasound and which provide information regarding changes in collagen structure, elasticity, and ultrastructural skin features. Reviewing the papers, we selected the set of skin properties that could be helpful to assess the anti-aging therapy16,19,25. In the next section, we propose the new parameters resulting from the image analysis, which can be successfully applied in this field.
Thickness
Verigilio et al.15 mention the relative reduction in skin thickness caused by aging in the photo-exposed areas. They report that the thickness of the sun-exposed area tends to increase after age 60, whereas the thickness of the photo-protected area tends to decrease. Based on the forearm area, the observation does not show the correlation of thickness with chronological but only photo-aging. The authors15,24,26 agree that there are no significant changes, correlating with age, in the epidermis and dermis thickness in photo-protected areas. On the other hand, the influence of anti-aging therapy on the skin layer thickness is undertaken in16,19,25. In the 1-year experiment described in25, retinaldehyde treatment induced a significant increase in epidermal (entry echo layer) thickness of the temple, compared to the control group \((p<0.01)\). The same outcomes are described in16, where the thickness of the epidermis (entry echo layer) increased significantly in the group of young participants at 60 days of vitamin C-based therapy compared with 40 days and before it. Unfortunately, the experiments from19 with topical ascorbic acid application did not confirm this.
TCA is described in literature21 as reducing the stratum corneum and decreasing the dermis thickness. According to works reviewed in27, there is no possibility of varying the different epidermis layers while using the 24 MHz transducer. It is debatable whether the entry echo corresponds to the total epidermis thickness or is only related to the stratum corneum, which is important in this study. As for the dermis layer, the need for a manually annotated repository for an automated segmentation algorithm and difficulties in differentiating between the dermis and lower layer makes the measurements impossible. Unfortunately, this problem is not addressed in the literature.
Considering all the above, we decided to use the entry echo layer thickness as the first parameter analyzed in the TCA assessment.
Echogenicity
The echogenicity of consecutive visible layers is widely described in literature16,19,27 as a valuable parameter in skin diagnosis. Based on the principles of ultrasound imaging, we can assume that bright or hyperechoic regions represent an increase in tissue density, while dark or hypoechoic areas represent a decrease. As reported in27 low echogenic region below the entry echo layer refers to the papillary dermis, whereas the brighter region below it stands for the reticular layer. The difference is related to the tighter packing of thick parallel arranged bundles of collagen in deeper layers of the skin. Moreover, the echogenicity of the dermis is influenced by several factors, and any pathological conditions associated with fiber accumulation will increase it27. For instance, botulinum toxin injections increase subcutaneous echogenicity5. Similarly, enhancement of fiber damage, inflammation, or water content decreases echogenicity. In the case of inflammatory dermatoses, a subepidermal low echogenic band (SLEB) is characteristic. However, it is also visible in sun-exposed skin in elderly individuals. On the other hand, the echogenicity tends to increase with age corresponding to increase collagen production5. Changes in skin echogenicity are widely reported in anti-aging therapies13,14,16,19. The experiments described in16 demonstrated increased echogenicity in both the epidermis and dermis after 40 days and, to a greater extent, after 60 days of topical vitamin C therapy. Tedeschi et al.14 reported an increase in SLEB echogenicity after mesotherapy with hyaluronic acid, and Vergilio et al.19 described an increase in high echogenic pixels in the dermis, after 30 days of anti-aging therapy compared to the placebo group. On the other hand, a decrease of dermal echogenicity in long-term follow-up after hyaluronic acid injection is reported in13.
In21, the authors mention the improved quality of elastic and collagen fibers due to the promotion of collagen fiber synthesis and increased water and glycosaminoglycan content in the dermis as an outcome of TCA peeling. Based on this claim and considering the above observations, we analyze the skin echogenicity in various skin areas (see Fig. 2): entry echo layer, outer part of entry echo layer – top 0.1 [mm], upper dermis − 0.2 [mm] below the entry echo layer (in some patients it corresponds to SLEB), dermis − 0.4 [mm] below the previous region.
Moreover, we propose a different intensity-based parameter – the ratio of the upper dermis to the epidermis (entry echo) intensities.
LEP, MEP, HEP
The numbers of pixels in various ranges of intensities were first described for skin diagnosis assessment in16, for analyzing the role of vitamin C in skin aging. LEP stands for the number of low, MEP for medium, and HEP for high echogenic pixels in the considered skin layers. Additionally, the authors analyze the LEPs/LEPi, as the ratio between the number of echogenic pixels in the upper and lower dermis. Assuming the intensity range in grayscale as 0–255, the LEP corresponds to the intensities range 0–30, the MEP 50–150 interval, and HEP 200–255.
According to16, LEP quantifies the degree of cutaneous hydration, inflammatory processes, solar elastosis, and collagen degeneration, MEP and HEP quantify the structures of collagen, elastin fibers, and microfibrils, and the LEPs/LEPi ratio allows an appreciation of the density and integrity of the extracellular matrix. The authors claim that the LEP decreased significantly in all age categories during and after the therapy, whereas both MEP and HEP increased. They explain this phenomenon by the significant increase in local protein synthesis. The LEPs/LEPi ratio does not vary significantly, increasing at the beginning and decreasing at the end of the considered time interval. In the placebo group, the LEP of the dermis increased. In contrast, the MEP and HEP decreased, which the authors explain as the effect of optimal hydration caused by applying the moisturizing cream.
Since the TCA peeling is described as21 stimulating fibroblasts to produce elastin, activate the skin stress response system and improve skin quality (better brightness, elasticity, and turgor), the bunch of above mention parameters are also calculated in our work.
Roughness
The superficial roughness as the parameter for assessing topical ascorbic acid application results is proposed in19. It measures the interfacial perimeter of the skin, which can be connected with wrinkling of its surface. According to19, the superficial roughness parameter presented a considerable decrease 30 days after the application compared to two hours after it.
One of the declared TCA effects is wrinkles reduction. As reported in28 in the group of patients with the preferable results using the global aesthetic improvement scale (GAIS) after the TCA therapy, the participants indicated lower laxity and fewer wrinkles. Therefore, in our study, the surface roughness is measured as well.
Image processing methods
The above-referred methods13,14,16,19 describe the medical aspects of anti-aging therapies, utilizing the benefits of HFUS imaging. However, they lack reliable and repeatable methodology for image analysis. To meet this need, we propose a fully automated algorithm for quantitative assessment of the effectiveness of TCA peeling, which can be successfully applied in various applications connected with the evaluation of cutaneous conditions. The block diagram of the proposed algorithm is presented in Figure 3. The flow chart consists of two main parts: image quality assessment and segmentation steps. The segmented cutaneous areas are then utilized for skin parameters estimation in TCA therapy.

Block diagram of image processing method.
Image quality assessment
Since the collected image series includes both the image data suitable for further diagnosis or not, they were first evaluated using the deep learning-based image quality assessment algorithm29. The method utilizes the benefits of a fuzzy interference system (FIS) with the VGG-16 model. For further analysis, only the images classified by the system as ’perfectly ok’ with a probability over \(90\%\) were considered. Since two experts also annotated the image data, the obtained classification results were compared with the exert decision. The proceeded HFUS data set was proven to consist of high-quality and diagnostically reliable image samples. The HFUS facial skin images used in this analysis are publicly available under23, and details concerning the data structure are described in29. Two examples of HFUS images are shown in Figure 2.
Segmentation
The skin parameters estimation is preceded by a fully automated segmentation step for reliable and repeatable analysis. Based on the previous work30, the developed method applies DeepLab v3+ network with ResNet-50 backbone followed by fuzzy connectedness step. The DeepLab v3+ network is trained using the HFUS images publicly available in22. As reported in30, for this data22, the segmentation accuracy (Dice index) of the entry echo layer was equal to 0.919. The training data were acquired with the same US machine (DUB SkinScanner75) but with different transducers frequency (75 MHz). Therefore, some additional post-processing steps are introduced. First, to avoid the influence of artifacts on the image border, the resulting masks are limited to the central part of the image – excluding 20 [pix] from each border area. It reduces the 12.8898 [mm] width image of 0.372 [mm] (\(2\%\)). Second, morphological operations are used to remove small objects. The exemplary segmentation results are delineated in blue in Figure 2. Before further analysis, the expert in HFUS skin imaging visually analyzes the segmented regions.
Skin parameters estimation
The segmentation mentioned above results in the entry echo area, and the other cutaneous regions are defined with respect to it. Since all the considered skin images are registered using the same acquisition parameters and all the HFUS images contain the visible ruler graduated in millimeters, direct comparison of echogenicity levels and estimation of actual pixel size is possible. Assuming that the skin layers are almost parallel, the regions for the echogenicity are defined considering the segmented entry echo layer and the previously estimated pixel size at different depth levels visualized in Figures 2 and 4. Because the automated segmentation step is limited to the entry echo area, the changes in thickness are evaluated only for this region.
Since, in this analysis stage, we cannot assume the constant thickness of the consecutive layers (we even expect some changes), the absolute number of pixels used for LEP, MEP, and HEP values estimation can lead to gross errors. Therefore, in our approach, all these parameters are normalized by the number of pixels creating the analyzed areas. They are estimated for all the skin layers visualized in Figure 2. The exemplary nLEP for the entry echo layer is defined as:
$$\begin{aligned} nLEP = \frac{n_{30epi}}{n_{epi}} * 100\%, \end{aligned}$$
(1)
where:
\(n_{30epi}\)—number of pixels belonging to the entry echo layer with intensity level in [0–30], \(n_{epi}\)—number of pixels belonging to the entry echo layer.
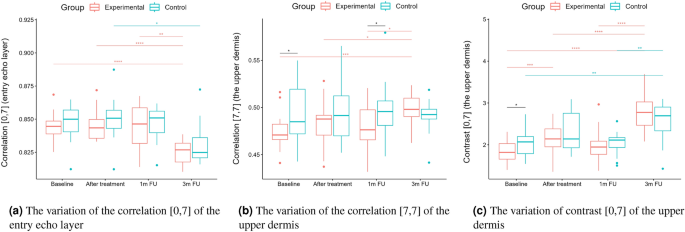
According to19, surface roughness is considered a valuable measure for the anti-aging therapy assessment. Therefore, we propose two different roughness definitions relating to various aspects of skin analysis. The first one, more intuitive, is the ratio of the length of the actual edge of the segmented entry echo layer to the width of this layer (\(\frac{A}{B}\) in Fig. 4a). It relates directly to the roughness of the skin surface, whereas the second definition refers to the skin’s internal structure. It measures the roughness based on the texture parameters and gray level co-occurrence matrix (GLCM)31. The GLCM includes the information on how often a pixel with the intensity a value occurs in a predefined spatial relationship to a pixel with the value b (see Figure 4). Based on numerical experiments and considering the characteristic pattern appearing in the segmented layers, the GLCM parameters E and D visualized in Figure 4 are set to 5 and 7, respectively, and the number of utilized gray levels is limited to 128. Based on the obtained GLCM parameters, the following texture measures are analyzed: contrast, representing the local variations in the GLCM; correlation, measuring joint probability occurrence of the specified pixel pairs; energy, describing the uniformity of the analyzed region; and homogeneity. Additionally, entropy, which measures the disorder within the analyzed region, is considered.
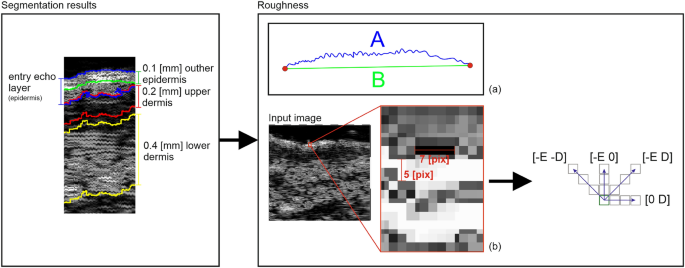
Roughness parameters estimation.
Statistical analysis
Statistical analysis was performed based on the results obtained from 43 women (22 in the experimental and 21 in the control group) in a double-blinded study. The skin hydration and demographic features of women in these two groups revealed that at baseline, the groups were not statistically significantly different for any of the considered variables (\(p>0.05\) in all cases). However, some of the cutaneous parameters resulted from the HFUS analysis differed significantly from the beginning of the experiments (see Fig. 6a,c,7b,5a,11a–c,12b).
A two-way repeated measure ANOVA was performed to evaluate the effect of TCA peel administration on HFUS skin parameters measured with DUBSkinScanner75 at four-time points compared to the control group. The obtained results are shown in Figures 5, 6, 7, 8, 9, 10.
In the case of confirmed interaction, the differences between groups were assessed separately at individual time points. No interaction indicates that the differences between the group means did not change significantly over time – did not depend on the measurement time point. Each statistically significant effect was assessed in terms of its size, and minor effects, being clinically irrelevant, were not reported in this paper.
Boxplots present the median, the first and third quartile, and the whiskers indicate the outliers range. Statistically significant differences are indicated with stars (*p<0.05; **p<0.01; ***p<0.001; ****p<0.0001), marked red for the experimental group, cyan for the control group, and black for between-groups comparisons.
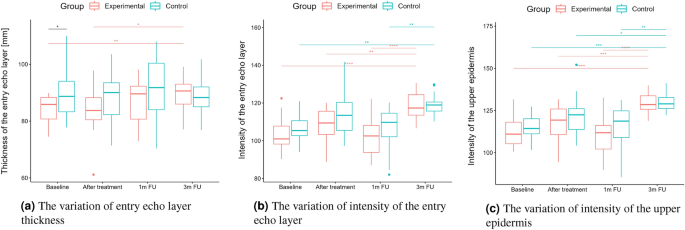
Thickness and intensities.


nLEP, nMEP, nHEP (entry echo layer).
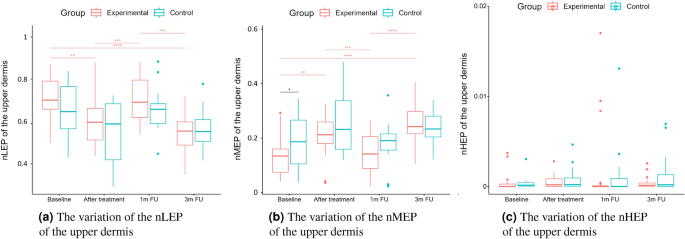
nLEP, nMEP, nHEP (upper dermis).
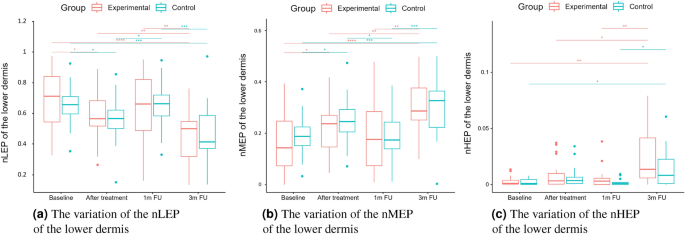
nLEP, nMEP, nHEP (lower dermis).

nLEP, nMEP, nHEP ratio, roughness, energy.

Bioethical approval & trial registration
The study was approved by the Research Bioethics Committee of the Academy of Physical Education in Katowice (Mikolowska 72a Street, 40-065 Katowice, Poland) under the reference number 3/2020 on 17 December 2020. Informed consent was obtained from all subjects involved in the study. The trial is registered under the number: ISRCTN41899475; (https://doi.org/10.1186/ISRCTN41899475).

