A total of 5750 individuals (2725 men and 3025 women) participated in the study. The characteristics of the study participants were grouped into five levels according to vitamin B1 quintile levels, as shown in Table 1. Significant differences were detected across all quintiles of vitamin B1 intake for age, sex, race, education, BMI, HU prevalence, vitamin C intake, vitamin B6 intake, folate intake, retinol intake, energy intake, protein intake, carbohydrate intake, serum cholesterol, and TG levels. Subjects with higher vitamin B1 intake tended to be younger, more likely to be non-Hispanic white, more likely to be male than female, to have higher intakes of vitamin C, dietary vitamin B6, folate, retinol, energy, protein, and carbohydrate, lower BMI, serum cholesterol, and TG, and less likely to have hypertension, diabetes, and HU.
The prevalence of hyperuricemia was 18.90% (20.15% in men and 17.79% in women). Comparison of vitamin B1 status and other indices between hyperuricemia and non-hyperuricemia is shown in Table 2. For men, the following indices were significantly different between hyperuricemia and non-hyperuricemia: race, alcohol consumption status, BMI, hypertension status, vitamin B1 intake, carbohydrate intake, retinol intake, serum glucose, serum cholesterol, and TG levels. Compared with participants without hyperuricemia, participants with hyperuricemia tended to be non-Hispanic white, have high blood pressure, higher BMI levels, serum glucose, serum cholesterol, and TG levels, and lower dietary vitamin B1 intake, carbohydrate intake, and retinol intake. For women, hyperuricemia patients tended to be older, have a higher prevalence of diabetes mellitus and hypertension, and have higher blood glucose, serum cholesterol, and TG levels, and lower dietary carbohydrate and vitamin C intakes (total 1.2%). P < 0.05).
As shown in Table 3, multivariate models were used to investigate the association between vitamin B1 intake and hyperuricemia. In this cross-sectional study, the association between dietary vitamin B1 intake and hyperuricemia was revealed based on the analysis stratified by gender. In the male population, a significant negative association was found between vitamin B1 intake and HU prevalence in models 1, 2, and 3, and the linear trend test showed a statistically significant difference (P (The values were 0.007, 0.028, and 0.028, respectively.) Model 3 also confirmed that higher vitamin B1 intake was associated with an inverse trend in HU risk after adjusting for age, race/ethnicity, smoking status, alcohol consumption status, education, hypertension status, diabetes status, protein intake, carbohydrate intake, retinol intake, vitamin B6 intake, folate intake, BMI, cholesterol, and TG. Compared with participants who consumed less than 0.94 mg of vitamin B1 per day, the relative odds of hyperuricemia were significantly reduced by 0.75 (odds ratio 0.75, 95% confidence interval 0.52-1.09) in participants who consumed 0.94-1.24 mg of vitamin B1 per day, 0.70 (odds ratio 0.70, 95% confidence interval 0.48-1.02) in participants who consumed 1.25-1.55 mg per day, 0.66 (odds ratio 0.66, 95% confidence interval 0.44-0.99) in participants who consumed 1.56-1.99 mg per day, and 0.55 (odds ratio 0.55, 95% confidence interval 0.34-0.90) in participants who consumed 2.00 mg or more per day. However, no significant difference was found between dietary vitamin B1 intake and risk of hyperuricemia in women.In women, after adjusting for multiple covariates, compared with Q1, the adjusted ORs for HU were 1.05 (95% CI 0.69, 1.60) in Q4 (those consuming 1.56-1.99 mg vitamin B1 per day), 0.75 (95% CI 0.42, 1.34) in Q5 (those consuming ≥2.00 mg), and 0.75 (95% CI 0.42, 1.34) in Q6 (those consuming ≥2.00 mg). P The trend is 0.876.
In this study, we further stratify the study population and investigate the relationship between vitamin B1 and hyperuricemia among subgroups, as shown in Table 4. First, five groups Q1-Q5 of vitamin B1 in non-Hispanic whites were observed by race, with OR values of 0.79, 0.80, 0.65, and 0.43, respectively. P The trend OR value was 0.017. No significant OR values were observed in other groups. In the middle-aged group (42-60 years), the OR values were 0.72, 0.64, 0.64, and 0.44, respectively, with increasing vitamin B1 intake (Q1-Q5). PThe value was 0.023. However, no relationship between vitamin B1 intake and HU was observed in the BMI and alcohol intake status groups.
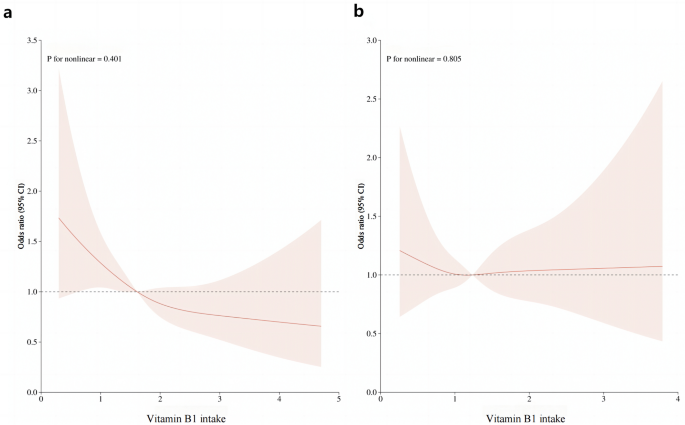
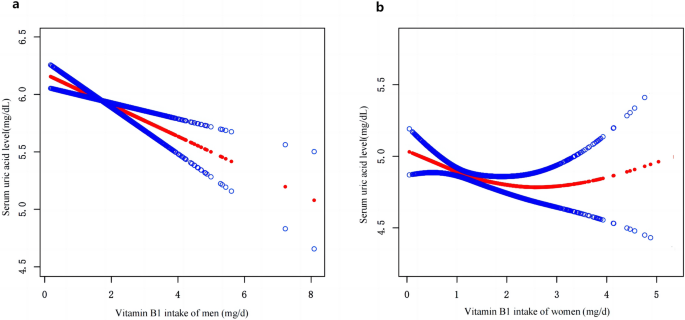
After multiple regression analysis, restricted cubic spline curves (RCS) were used to analyze the dose-response relationship between vitamin B1 and HU. As shown in Figure 1a, the results showed that there was a linear relationship between dietary vitamin B1 intake and HU risk in men (P= 0.401), and the prevalence of hyperuricemia decreased with increasing dietary vitamin B1 concentration. However, this trend was not observed in women (Fig. 1b). Furthermore, smoothed curve fitting analysis was performed to compare serum uric acid concentrations and vitamin B1 intakes of study participants. The results are shown in Fig. 2, indicating that vitamin B1 intake and serum uric acid concentrations were inversely correlated in men, and the higher the vitamin B1 intake, the lower the serum uric acid concentration in men. On the other hand, no significant relationship was found between vitamin B1 intake and serum uric acid concentrations in women.

RCS analysis of vitamin B1 intake and risk of hyperuricemia.One) RCS analysis of vitamin B1 in male population. (b) RCS analysis of vitamin B1 in the female population. The red line represents the trend and the light pink area is the 95% confidence interval.

Smooth curve fitting of participants’ serum uric acid concentrations and dietary vitamin B1 intake.

