
Ultra-high-performance liquid chromatography-tandem mass spectrometry assay
Using ultra-high-performance liquid chromatography (UHPLC) system, the vitamin D metabolites and their epimers (3-epi-25OHD) and isobar (7αC4) were separated adequately based on their retention times and polarities, as shown in Fig. 3. Figure 3 illustrates the chromatogram of standard vitamin D metabolites prepared in a surrogate matrix (artificial serum), the vitamin D metabolites chromatogram in human serum samples is provided in the Electronic Supplementary Material (ESM). Some vitamin D metabolites have similar retention times but different masses, as shown in Table 1; however, it will not be a problem since the tandem mass spectrometry (MS/MS) system can distinguish between these metabolites based on their masses, which makes the UHPLC-MS/MS technique powerful. Moreover, vitamin D metabolites and their epimers have similar structures, but their retention times are different, as shown in Table 1. 25OHD3 and its epimer and isobar have the same masses; therefore, analyzing these metabolites using only mass spectrometry will provide false-positive results. For instance, since the epimer and isobar of 25OHD3 share the same masses, they will interfere and coelute during 25OHD3 analysis; therefore, it will overestimate the actual 25OHD3 levels, as shown in Fig. 2.

Overestimation of 25OHD3 levels. The epimer and isobar of 25OHD3 overestimate the 25OHD3 levels when using mass spectrometry technique.
Under the applied electrospray ionization (ESI) source, the Multiple Reaction Monitoring (MRM) transitions for all vitamin D metabolites produce the protonated vitamin D compounds, [M + H]+. The precursor ions of some vitamin D metabolites were found to be the most sensitive after the loss of the water compound, and MRM mode was utilized to track the most sensitive product ions. The direct infusion of each vitamin D metabolite standard solution were used to optimize the MRM. The MRM transitions of vitamin D metabolites along with their collision energies are shown in Table 2.
The limitations of mass spectrometry and immunoassay techniques were solved when 25OHD2 and 25OHD3 and their epimers were separated and distinguished from each other by the UHPLC-MS/MS technique. Although 3-epi-25OHD3 and 25OHD2 have almost identical retention times, they exhibit different MRM and fragmentation behaviors, as shown in Fig. 3 and Table 2. Lastly, when the UHPLC and MS/MS work together, they provide a powerful combination for bioanalysis.
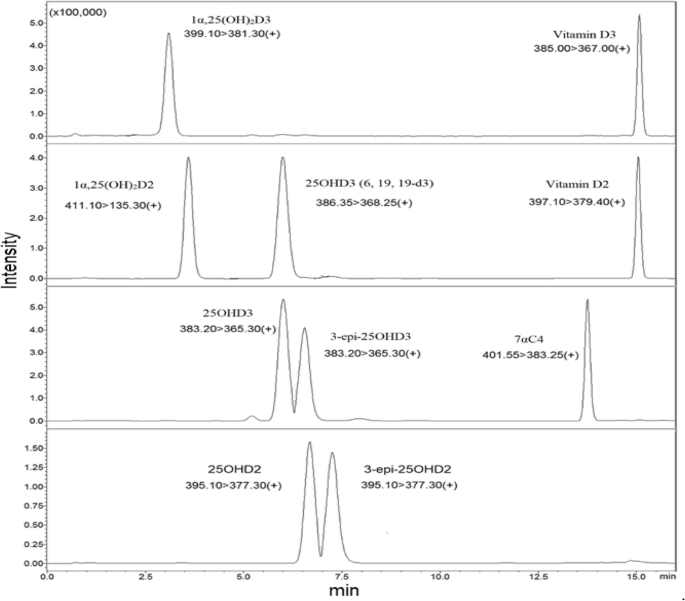
Vitamin D metabolites Chromatogram.The 25OHD3 and its isobar and epimer were adequately separated based on their polarities and retention times. Also, Other vitamin D metabolites were separated from each other sufficiently.
Validation of the method
Linearity of the calibration curves and quality controls
The coefficient of determination (R2) was used to express the linearity of a calibration curve. The linear range for some vitamin D metabolites was 0.5 to 100 ng/ml; for 1α,25(OH)2D was 0.015 to 1 ng/ml, as shown in Table 3. The ratio of vitamin D metabolite’s peak area to the internal standard’s peak area was plotted versus the vitamin D metabolite concentration to build the calibration curve. The R2 for all vitamin D metabolites ranged from 0.993 to 0.999, as shown in Table 3. Three levels of Quality Controls (QCs), including Quality Control Low (QCL), Quality Control Medium (QCM), and Quality Control High (QCH) were used to test the calibration curve. The concentrations of these QCs are shown in Table 3.
Precision and accuracy
Precision was expressed as the coefficient of variation percentage (CV%), while accuracy was expressed as the error percentage (PE%) between the value being measured and the nominal value. Six replicates of QCs at each level (QCL, QCM, QCH) were analysed on three separate days to determine inter-assay precision and accuracy, while the QCs analysed on one day were used to evaluate intra-assay precision and accuracy. The measured values of six replicates were used to determine the standard deviation and the mean, which were utilized to evaluate the intra- and inter-day precision and accuracy, as shown in the equations below. The values of precision and accuracy are illustrated in Table 3.
$$ \% {\text{CV }} = \frac{{\left( {\text{Standard deviation}} \right)}}{{\left( {{\text{mean}}} \right)}} \times 100 $$
(1)
$$ \% {\text{PE }} = \frac{{\left( {\text{mean value}} \right)}}{{\left( {\text{nominal value}} \right)}} \times 100 $$
(2)
Generally, the PE% was ranged from 85 to 101% while CV% was less than 15%; therefore, the values of accuracy and precision were found within an acceptable range of ≤ ± 15%.
Recovery percentage
The recovery percentage is the amount of analyte recovered or retrieved after extraction. Two sets of three levels of QCs at six replicates of each QC level were prepared to assess extraction recovery. In the first set, the vitamin D metabolites were spiked in methanol, while in the second set, they were spiked in a surrogate matrix and the extraction method was applied on the second set. After that, the results of the analysed two sets were compared using the peak’s area in the chromatogram. The recovery percentage was determined as follows:
$$ \% {\text{Recovery }} = \frac{{\left( {\text{mean extracted QC values}} \right)}}{{\left( {\text{mean unextracted QC values}} \right)}} \times 100 $$
(3)
The recovery percentage of vitamin D metabolites after liquid–liquid extraction was good and it ranged from 75 to 115%. The details are shown in Table 3.
Sensitivity
Sensitivity is referred to as the lowest concentration of analyte that can be detected. The Limit of Quantification (LOQ) and the Limit of Detection (LOD) were used to determine the sensitivity. The LOD was assessed by diluting the analyte concentration until the Signal to Noise ratio (S/N) equals 3, while for LOQ, the S/N ratio equals at least 10. The LOD ranged from 0.01 to 0.1 ng/ml, while LOQ ranged from 0.015 to 0.5 ng/ml. The values of LOD and LOQ are shown in Table 3. LOQ and LOD values were reported by different studies. For example, Mϋller et al.28 mentioned the value of LOQ, which was 0.1 and 1.0 ng/ml for 25OHD3 and its epimer, respectively. Furthermore, according to Ronda et al.29 who used LC–MS/MS 6490, the LOQ value was 1.36 and 1.52 ng/ml while the LOD was 0.68 and 0.76 ng/ml for 25OHD3 and its epimer, respectively. Additionaly, when they used LC–MS/MS 6410, the LOQ was 1.4 ng/ml and the LOD was 0.8 ng/ml for both 25OHD3 and its epimer. In another research, the LOQ value was reported as 0.25 and 0.3 ng/ml while LOD was 0.075 and 0.09 ng/ml for 25OHD3 and its epimer, respectively30. In this study, the LOD was 0.025 and 0.05 ng/ml for 25OHD3 and its epimer, respectively, while LOQ was 0.5 ng/ml for both metabolites. Generally, this explain that our method is very sensitive compared to the previous studies.
Specificity and stability
The specificity was determined by analyzing six blank serum samples (surrogate matrix). After that, the chromatograms of blank samples were overlaid to check for interfering or coeluting peaks. Figure 4 is showing the chromatogram of blank serum to confirm that there is no interfering or co-eluting peaks at the corresponding retention time of vitamin D metabolites ( the retention time of each vitamin D metabolite is mentioned in Table 1 and Fig. 3). Stability (%Change) is defined as the intactness of analyte amounts under certain storage and usage conditions over time compared to the initial amount. To evaluate the %Change, six replicates of spiked QCs at each level (QCL, QCM, QCH) were analyzed over three consecutive days when they were frozen and thawed three times at intervals of 0 h, 24 h, 48 h, and 72 h. The results of QCs at each interval were compared from time zero to calculate the %Change of vitamin D metabolites. The results illustrated that the %Change fluctuated within ± 60%, as shown in Fig. 5; therefore, the vitamin D metabolites are sensitive and less stable when they were exposed to freezing and thawing cycles. Finally, it is better to analyse fresh samples.

Overlaid of blank serum chromatograms illustrating the assay specificity. There were no co-eluting or interfering peaks at the same retention time of vitamin D metabolites.

The stability (%change) of vitamin D metabolites over three cycles of freezing and thawing. The Quality Control Low (QCL), Quality Control Medium (QCM), and Quality Control High (QCH) are denoted by grey, orange, and blue bars over three intervals, respectively. The %change of every metabolite was estimated by analyzing six replicates of quality controls at each concentration level (QCL, QCM, and QCH) over three intervals of freezing and thawing. Generally, the %change fluctuated within ± 60%.
Analysis of human serum samples (baseline, follow-up and healthy)
The most common vitamin D metabolite used to evaluate vitamin D status in blood samples is 25OHD. In this research, 25OHD3 and 25OHD2 concentrations were measured to diagnose vitamin D deficiency in the blood. For some reasons, measuring 1α,25(OH)2D metabolites is more difficult than measuring 25OHD. The first reason is that the 1α,25(OH)2D has a short half-life (4–15 h) compared to 25OHD (21–30 days), and the second reason is that it is less stable and exists in a low concentration in the blood31,32. The reference ranges of 25OHD were suggested by multiple organizations. For example, the Institute of Medicine proposed that the normal level of 25OHD is 20 ng/ml while the Vitamin D Council suggested the normal range of 25OHD is from 40 to 80 ng/ml33,34. One of the studies reported the reference range of a total 25OHD and 1α,25(OH)2D in the bloodstream. For instance, the normal levels of total 25OHD range from 25 to 80 ng/ml and the normal levels of 1α,25(OH)2D range from 18 to 64 pg/ml for males and 18 to 78 pg/ml for females35. Several studies have published various guidelines about the normal levels of 25OHD for good health; so, it appears that a consensus on a definitive adequate level of vitamin D has not been achieved12,36,37,38,39,40, as shown in Table 4.
In this study, the diagnostic criteria for vitamin D deficiency were less than 20 ng/ml (< 20 ng/ml) while the insufficiency ranged between 21 and 29 ng/ml and optimal were more than 30 ng/ml (> 30 ng/ml)12. The concentration of the active forms of vitamin D metabolites was increased when the baseline (obese subjects) took vitamin D supplements, as shown in Figs. 6, 7 and Table 5. The male and female obese subjects have high concentrations of vitamin D3 after vitamin D3 supplementation; consequently, there should be a significant increase of 25OHD3 and its epimer according to the fact that vitamin D3 undergoes hydroxylation process in the liver via CYP2R1 enzyme41,42. However, this study illustrated that although the 25OHD3 and its epimer increased significantly in supplemented subjects compared to baseline, the increase was insufficient to achieve the optimal range (> 30 ng/ml). A possible reason behind this is the possibility of vitamin D3 conversion to the other forms. For instance, vitamin D3 may be hydroxylated via the CYP11A1 enzyme and produce other forms of vitamin D, such as 22OHD3 and 20, 22(OH)2D3 in epidermal keratinocytes19,43,44. Furthermore, the CYP11A1 enzyme could be activated by UVB light (wavelength, 290–315 nm); as a result, the bioavailability of vitamin D3 substrate will be less for the generation of 25OHD3 and its epimer by classical hydroxylation45.

a comparison of the levels of vitamin D metabolites in plasma samples from male and female volunteers. In baseline subjects, 3-epi-25OHD2 was not detected, and in healthy, follow-up, and baseline subjects, 1α,25(OH)2D was not detected by the instrument. p < 0.05 = *, p < 0.01 = **, p < 0.001 = ***, ns = no significance.

a comparison of the levels of vitamin D metabolites in plasma samples. In baseline subjects, 3-epi-25OHD2 was not detected, and in healthy, follow-up, and baseline subjects, 1α,25(OH)2D was not detected by the instrument. p < 0.05 = *, p < 0.01 = **, p < 0.001 = *** , ns = no significance.
The data from Figs. 6, 7 and Table 5 reveals that the levels of vitamin D2 and D3 are quite comparable between baseline and healthy control subjects. Moreover, it shows that vitamin D3 is extraordinarily high compared to 25OHD3. Let’s delve into the reasons behind this:
Storage in Fat Cells: Vitamins D2 and D3 are fat-soluble. In obese individuals, these vitamins are stored in fat cells, or adipocytes. This means that, even if obese subjects have more of these vitamins in storage, it might not be readily reflected in their bloodstream.
Conversion to Active Form: The hydroxylation of vitamin D2 and D3 to their active form, 25OHD happens readily. This conversion is less efficient in obese subjects compared to healthy ones. One key reason for this is the lower expression of the CYP2R1 enzyme in obese individuals. As CYP2R1 facilitates the hydroxylation process, its reduced activity in obese patients means fewer vitamins D2 and D3 are transformed to 25OHD. Moreover, since the conversion of vitamin D3 to 25OHD3 is less efficient in obese subjects, the vitamin D3 concentration will be extraordinarily high compared to 25OHD3.
Effect on Vitamin D Levels: Despite obese individuals possibly having more stored vitamin D2 and D3 due to their fat content, the decreased conversion means that the bloodstream levels of these vitamins are quite similar to those in healthy individuals. However, because of this reduced conversion, the level of the active form, 25OHD, is actually higher in healthy individuals than in obese subjects.
Half-life Consideration: It’s crucial to remember that vitamins D2 and D3 have a half-life of approximately 24 h, meaning they are metabolized relatively quickly. In contrast, their downstream metabolite, 25OHD, has a longer half-life of about 15 days. This longer duration combined with the inefficient conversion in obese subjects further accentuates the difference in 25OHD levels between the two groups.
Generally, while obese and healthy individuals might have similar bloodstream levels of vitamins D2 and D3, the reduced efficiency of conversion in obese subjects means they have lower levels of the active metabolite, 25OHD. This discrepancy underscores the importance of considering both storage and metabolic factors when assessing vitamin D status46.
According to Table 5, when 25OHD2, 3-epi-25OHD2, 25OHD3, 3-epi-25OHD3 are summed together as total 25OHD, the follow-up and healthy subjects will have sufficient 25OHD (> 30 ng/ml). The immunoassay technique measures the total 25OHD, which overestimates the actual 25OHD3 and gives false-positive results. This means that the UHPLC-MS/MS technique is accurate, precises, and specific since it can distinguish between vitamin D metabolites.
A total of 277 participants, with an average age of 41 ± 12 years, were part of a 6-month study, of which 204 (74%) were female. Based on the WHO BMI classification, 65 participants (25%) had a normal BMI, 92 (35%) were overweight, and 106 (40%) were classified as obese at the beginning of the study. Table 6 presents the initial clinical, metabolic, inflammatory and lipid profile markers for the overweight and obese groups in comparison to the normal weight group. From the 277 participants, there was a noticeably higher prevalence of diabetes and hypertension in the overweight and obese categories than in the normal BMI category, as indicated in Table 6. Both at the start and end of the study, blood pressure, inflammatory markers, metabolic markers, and lipid profiles, specifically LDL & TG, were observably elevated, while HDL showed a marked decrease in the overweight and obese groups compared to the normal weight group, as shown in Table 6. Detailed information regarding the correlations between vitamin D metabolites and the severity of weight excess (BMI) and C-reactive protein (CRP) is provided in the electronic supplementary material (ESM).
When the epimer and isobar are not separated adequately from 25OHD3, they will interfere and overestimate the actual levels of 25OHD3, as shown in Fig. 8. The baseline, follow-up, and healthy subjects are considered to have deficient levels of 25OHD3 and 25OHD2 when epimers and isobars are removed from the commonly measured 25OHD, as shown in Fig. 9. Also, when 25OHD2 and 25OHD3 are summed together, the healthy subjects will have optimal levels of 25OHD (> 30 ng/ml), the follow-up subjects will be in the insufficient range (21–29 ng/ml), and the baseline subjects will have deficient levels of 25OHD (< 20 ng/ml), as shown in Fig. 9. Typically, this study demonstrates the power of the UHPLC-MS/MS because this technique excludes the epimer and isobar from 25OHD by separating them based on their polarity, retention time, fragmentation behavior, and mass-to-charge ratio (m/z) leading to accurate results. Finally, the comparison of the data obtained by the immunoassay/commercial chemiluminescence vitamin D assay and those obtained by the UHPLC-MS/MS assay was published previously47.

A comparison between the concentration of vitamin D metabolites in mixed gender of healthy, follow-up, and baseline subjects. The stacked column in the chart illustrates the sum of 25OHD and its epimer and isobar when these metabolites are not separated sufficiently. The Error bars describe the standard errors of the mean. .

A comparison between the concentration of 25OHD2 and 25OHD3 after the epimers and isobar were excluded in mixed gender of healthy, follow-up, and baseline subjects. The stacked column in the chart illustrates the sum of 25OHD2 and 25OHD3 when these two metabolites are not distinguished from each other adequately. The Error bars describe the standard errors of the mean.